download a folder with demos of some of our products and services
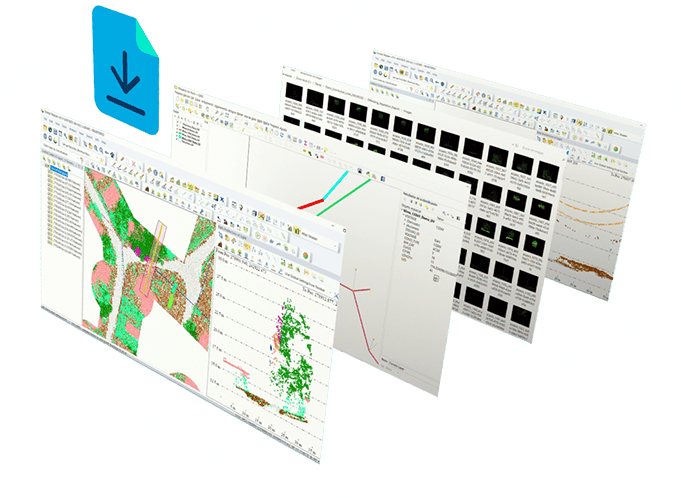
From this website, you can DOWNLOAD VARIOUS SAMPLES of the standard products that DIELMO 3D typically produces as a result of advanced LiDAR data processing, vector mapping, PLS-CADD modeling, etc.
We have selected an area with publicly available LiDAR data with more than 50 points/m2 to carry out this demo of the deliverables that we typically produce for distribution power lines. This is just an example; for each project, we customize the results to be delivered and the algorithms to calculate them based on the client’s specifications.
includes:
- RClassified LiDAR point cloud and classification table (41 classes).
- RVector layers with corrected network (wires and towers) from LiDAR data.
- RReport of distances to offending vegetation in SHP, KML, EXCEL formats and a PDF for each span with the summary of incidences.
- RReport of distances to ground and roads.
- RReport with the description of all deliverables.
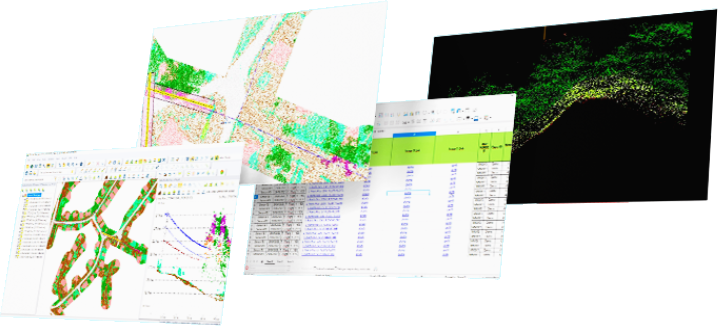
We have used a portion of the data from the previous sample to conduct this demo of the deliverables we typically produce for transmission power lines. These deliverables are additional to those from the previous sample and are usually only done for transmission lines.
includes:
- R3D mapping of the catenary and electrical towers including support points.
- R2D mapping of the power line environment.
- RPole lean report.
- RPLS-CADD modeling.
- RReport with description of all deliverables.
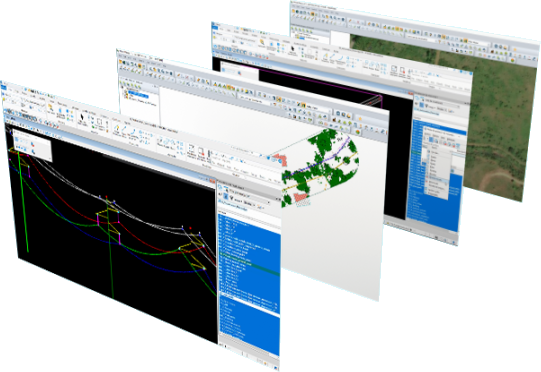
Building upon the deliverables described earlier and others, we have created a series of web geoportals as an example of how the results could be delivered to be accessible via the internet with secure data access thanks to our Dielmo Maps tool.
includes:
- RLinks to both distribution and transmission geoportals of electricity grids from previous demos in addition forest geoportal from aerial LiDAR.
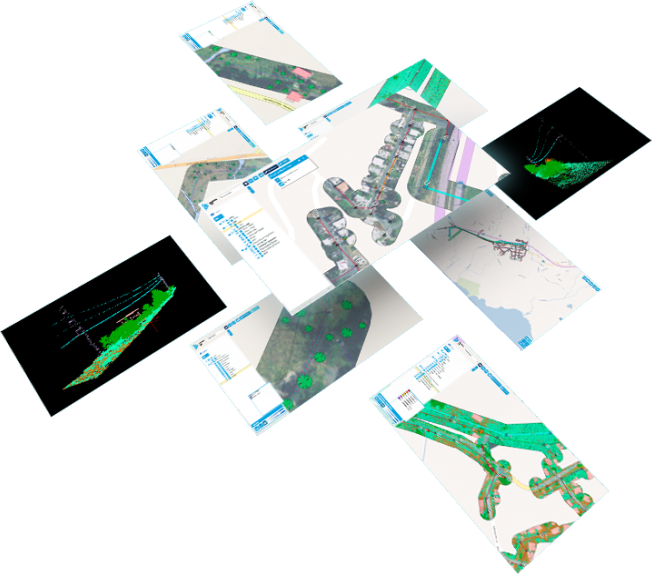
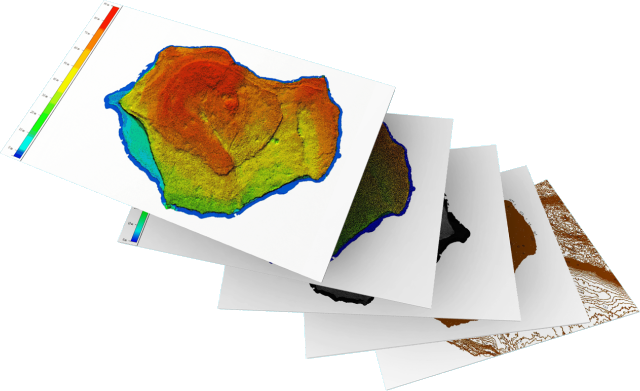
Examples based on freely distributed data.
includes:
- RDigital Terrain Model (DTM) with 1m resolution.
- RDigital Surface Model (DSM) with 1m resolution.
- RHillshade of the DTM and DSM.
- RContour lines.
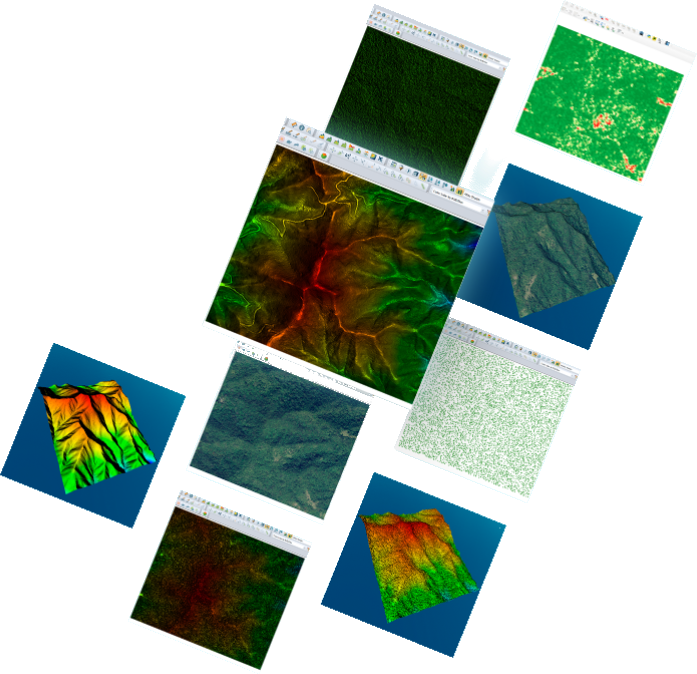
includes:
- RClassified LiDAR point cloud and classification table.
- RCanopy Cover.
- RCanopy Cover by Ranges
- RTree Position.
- RVegetation Height.
- ROrthophoto of the area.
- RDigital Terrain Model (DTM) with 1m resolution.
- RDigital Surface Model (DSM) with 1m resolution.
- RContour lines.
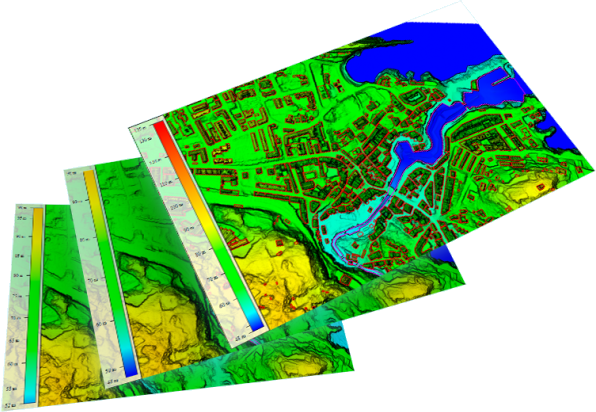
includes:
- RLiDAR point cloud with automatic classification and manual review of the soil in the study sections and adjacent areas.
- RDigital Surface Model (DSM) with 1m resolution.
- RDigital Terrain Model (DTM) with 1m raw resolution, with closed riverbed.
- RDigital Terrain Model (DTM) with 1m resolution, without any constructions and with the applied improvement of the riverbed and/or bathymetry.
- RDigital Terrain Model (DTM) with 1m resolution, with constructions and with the applied improvement of the riverbed and/or bathymetry.
- RShapefiles with the study area segment, riverbed width, buildings, bridges, and block.
By filling out this form, we will email you all available demos
